12 Employee Retention KPIs and Metrics for U.S. Companies to Track
Last Updated Nov 4, 2025

Turnover doesn’t just cost money — it costs momentum. And without the right data, it's tough to know where things are going wrong.
Every employee departure triggers a ripple effect: lost productivity, rising recruitment costs, and cultural disruption. If you’re not tracking what’s driving attrition, you’re stuck playing defense.
That’s where employee retention KPIs come in. These metrics give HR leaders a clear view of workforce stability — and the insights to improve it. From spotting early warning signs to evaluating the success of retention programs, the right KPIs help you take proactive, strategic action.
Unlock the power of employee retention KPIs and take control of turnover before it takes control of your team.

What You’ll Learn:
- Why Retention Tracking Matters for Business Health: How consistent measurement of retention metrics helps U.S. companies f costs (often 30%+ of a new hire’s salary), protect productivity, and strengthen culture and morale.
- Top 12 KPIs Every HR Leader Should Measure: From overall retention and turnover rates to voluntary/involuntary exits, tenure, and high-performer retention — each metric explained with formulas, examples, and why it matters.
- How to Build a Retention KPI Tracking System (Step-by-Step): A practical 10-step framework — from defining your business case and auditing data to selecting tools, training managers, and establishing reporting cadence.
- Data-Driven Decision Making for HR: How to translate retention insights into strategic action — improving onboarding, leadership, engagement, and wellbeing programs based on measurable trends.
- Driving Organizational Impact: How to use retention data to gain executive buy-in, quantify HR ROI, and build a workplace where employees want to stay — boosting employer brand, workforce stability, and long-term growth.
Why Measuring Retention Is Critical for U.S. Businesses
Turnover isn’t cheap. Every time an employee leaves, U.S. companies lose time, productivity, and capital. In fact, recruitment and onboarding costs can exceed 30% of that employee’s first-year salary. And that’s not including the impact on morale, team performance, or institutional knowledge.
By measuring retention consistently, you can:
- Spot flight risks before they become exits
- Link engagement trends to business outcomes
- Understand which teams, roles, or managers need support
- Assess the effectiveness of your retention and wellbeing programs
This can lead to business-critical improvements across the board, such as:
- Cost Control: Tracking retention helps identify where you're losing talent—and why. This insight can reduce the high costs of constant rehiring, retraining, and productivity loss.
- Workforce Stability: Retention data reveals trends over time, helping you plan proactively for team shifts, skill gaps, and long-term hiring needs.
- Engagement & Culture: Measuring turnover alongside engagement scores helps you understand what’s driving satisfaction—and what’s not. That leads to smarter interventions and stronger cultures.
- Employer Branding: When your company retains talent, word gets out. Employees become brand ambassadors, and candidates are more likely to trust your culture.
- ROI on HR Programs: Retention metrics help quantify the success of wellness initiatives, development programs, and compensation changes by linking them directly to reduced attrition.

Top 12 Employee Retention KPIs to Measure
Understanding retention is about more than a single metric. Measure and analyze these top 12 employee retention KPIs for more insights into your workplace.
- Overall Employee Retention Rate
Your overall employee retention rate tells you what percentage of your original workforce stayed with the organization over a defined time period. It’s a foundational KPI — and the first signpost for tracking improvements in your retention strategy over time.
Formula: Overall Employee Retention Rate = ((Employees at end of period − New hires during period) ÷ Employees at start of period) × 100
How to calculate it, step-by-step:
- Choose your time period. Common options are monthly, quarterly, or annually.
- Count how many employees were on staff at the start of that period. Include everyone employed on day one.
- Count how many employees remain at the end of the period. Exclude any new hires.
- Count how many new hires joined during that time.
- Plug the numbers into the formula. This gives you the % of original employees still with the company.
Example:
- Start of period: 50 employees
- End of period: 55 employees
- New hires during the period: 10
- Retention rate: ((55 − 10) ÷ 50) × 100 = (45 ÷ 50) × 100 = 90%
Why this matters: This metric isolates the employees who were with you at the beginning of the period and evaluates how many stayed. It helps you understand the stability of your workforce and provides a benchmark for evaluating the effectiveness of any retention initiatives over time.
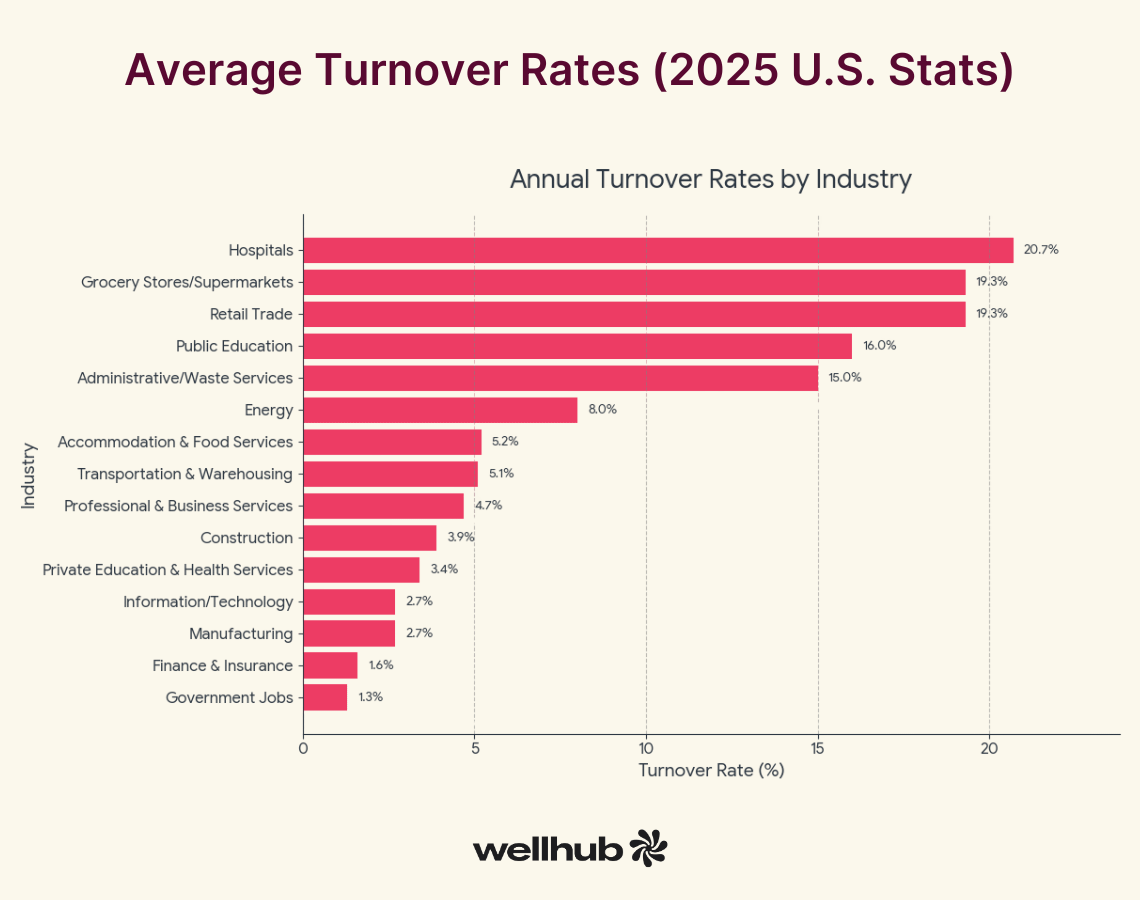
- Track Your Overall Turnover Rate
Your overall turnover rate tells you what percentage of employees leave your organization during a set time period — for any reason. It’s one of the most basic, high-level indicators of workforce stability and culture.
Formula: Overall Turnover Rate = (Number of employees who left during the period ÷ Average number of employees during the period) × 100
How to calculate it, step-by-step:
- Define your timeframe. Choose a consistent period — monthly, quarterly, or annually.
- Count how many employees left during that period. Include both voluntary and involuntary separations.
- Calculate your average employee count. Add your employee count at the beginning and end of the period and divide by two.
- Plug in your numbers. Use the formula to get your turnover rate.
Example:
- Employees at start of quarter: 60
- Employees at end of quarter: 40
- Employees who left: 20
- Average number of employees: (60 + 40) ÷ 2 = 50
- Turnover rate: (20 ÷ 50) × 100 = 40%
Why this matters: This number gives you a bird’s-eye view of workforce health. Spikes in turnover might indicate larger issues like culture misalignment, poor leadership, or compensation concerns.
- Measure Voluntary Turnover Rate
Voluntary turnover tracks the percentage of employees who choose to leave — for another job, for personal reasons, or due to burnout. It helps you evaluate whether your employee experience is compelling enough to keep top talent.
Formula: Voluntary Turnover Rate = (Number of voluntary separations ÷ Average number of employees during the period) × 100
How to calculate it, step-by-step:
- Set your timeframe. Annual is standard, but quarterly can offer sharper insights.
- Count voluntary separations. Only include employees who left by choice (not those who were let go).
- Find your average number of employees. Use the same method as above: (start + end) ÷ 2.
- Run the calculation. Input into the formula.
Example:
- Start of year: 200 employees
- End of year: 160 employees
- Voluntary departures: 25
- Average headcount: (200 + 160) ÷ 2 = 180
- Voluntary turnover rate: (25 ÷ 180) × 100 = 13.9%
Why this matters: High voluntary turnover is costly and often preventable. It may signal problems with management, workload, or burnout — all things you can address once you identify them.
- Monitor Involuntary Turnover Rate
Involuntary turnover tracks the percentage of employees who are terminated by the organization. This includes layoffs, performance-based firings, and policy violations.
Formula: Involuntary Turnover Rate = (Number of involuntary terminations ÷ Average number of employees during the period) × 100
How to calculate it, step-by-step:
- Choose your reporting period.
- Count the number of employees let go. Don’t include voluntary exits.
- Calculate your average workforce size.
- Apply the formula.
Example:
- Start of period: 100
- End of period: 90
- Involuntary terminations: 8
- Average headcount: 95
- Involuntary turnover rate: (8 ÷ 95) × 100 = 8.4%
Why this matters: A high rate may indicate flaws in your hiring process or onboarding experience. It could also point to leadership or cultural issues that create friction between employees and management.
- Calculate Cost of Employee Turnover
Turnover isn't just a metric — it’s a line item. Cost of turnover captures the financial impact of losing employees, including hiring costs, training time, and lost productivity.
Formula: Cost of Employee Turnover = Total number of employees × Turnover rate × Average cost per departure
How to calculate it, step-by-step:
- Determine your turnover rate. Use either overall or voluntary, depending on your focus.
- Estimate the average cost per employee departure. This includes:
- Recruitment
- Onboarding/training
- Lost productivity
- Lost institutional knowledge
- Apply the formula to your organization’s size.
Example:
- Total employees: 100
- Turnover rate: 5%
- Avg cost per departure: $10,000
- Cost: 100 × 0.05 × 10,000 = $50,000
Why this matters: This figure is a powerful way to get leadership buy-in for retention strategies. It ties HR metrics directly to the bottom line.
- Segment Retention Rate by Employee Type
This metric zooms in on retention by team, role, or demographic group — giving you a focused lens to see where retention is strong or slipping.
Formula: Retention Rate per Employee Type = (Employees in group at end of period ÷ Employees in group at start of period) × 100
How to calculate it, step-by-step:
- Select a group to track. (e.g., sales team, customer service, women in tech, etc.)
- Count how many were in the group at the start of the period.
- Count how many remain at the end.
- Calculate the retention rate.
Example:
- Engineers at start: 20
- Engineers at end: 18
- Rate: (18 ÷ 20) × 100 = 90%
Why this matters: This granular insight helps you identify departments or roles with hidden attrition risks — or success stories you can replicate.
- Track Employee Satisfaction (ESI or eNPS)
Happy employees stay. ESI and eNPS give you a pulse on how people feel about your workplace — and how likely they are to stick around.
Metrics to consider:
- Employee Satisfaction Index (ESI): Employees rate satisfaction on a scale of 1 to 10.
- Employee Net Promoter Score (eNPS): “How likely are you to recommend this as a place to work?”
How to calculate it, step-by-step:
- Choose your tool. ESI for deeper feedback, eNPS for benchmark comparisons.
- Conduct anonymous surveys. Keep it short and regular (e.g., quarterly).
- Track score changes over time.
Why this matters: A downward trend in satisfaction often predicts higher turnover. Tracking sentiment proactively helps you intervene before issues escalate.
- Measure Average Employee Tenure
This metric tells you how long your employees stick around, on average. It's a great companion to your retention rate and gives a long-term view of workforce stability.
Formula: Average Employee Tenure = Total years of service for all employees ÷ Total number of employees
How to calculate it, step-by-step:
- Add up each employee’s tenure. From start date to current date or exit date.
- Divide by your total active headcount.
Example:
- Employee A: 3 years
- Employee B: 9 years
- Employee C: 12 years
- Total tenure: 24 years
- Employees: 3
- Average tenure: 24 ÷ 3 = 8 years
Why this matters: Low tenure may indicate onboarding issues or cultural misalignment. High tenure often signals loyalty, satisfaction, and internal growth opportunities.
Losing great people? Uncover the top reasons employees leave—and what to do to keep them.
- Monitor New Employee Retention Rate
This KPI tracks how well you retain new hires — often defined by whether they stay 30, 60, or 90 days. It reflects how strong your recruiting and onboarding processes are.
Formula: New Employee Retention Rate = (Number of new hires who stayed past threshold ÷ Total number of new hires) × 100
How to calculate it, step-by-step:
- Pick your retention threshold. Common options: 30, 60, or 90 days.
- Count new hires during the period.
- Count how many stayed past the threshold.
- Calculate the rate.
Why this matters: A low new hire retention rate may mean your onboarding needs work — or that your hiring process isn’t setting the right expectations.
- Calculate High-Performer Retention Rate
Not all turnover is equal. This KPI helps you understand how well you're retaining the employees who contribute the most.
Formula: High-Performer Retention Rate = (High performers at end of period ÷ High performers at start) × 100
How to calculate it, step-by-step:
- Identify your high performers. Use performance ratings or manager evaluations.
- Count how many were employed at the start.
- Count how many stayed.
- Use the formula to get your rate.
Why this matters: When top performers leave, productivity drops and morale suffers. This metric helps you protect your most valuable talent.
- Track Underperformer Retention Rate
This one flips the script. It measures how many low performers you’re keeping — and ideally, this number should go down over time.
Formula: Underperformer Retention Rate = (Underperformers at end of period ÷ Underperformers at start) × 100
How to calculate it, step-by-step:
- Identify underperformers. Use reviews, PIPs, or performance flags.
- Count how many were employed at the start.
- Count how many are still with you.
- Calculate the rate.
Why this matters: A high underperformer retention rate suggests you need to improve performance management. It also points to culture and accountability gaps.
- Measure Absence Rate
Absenteeism can be a warning sign of burnout, disengagement, or poor health. Tracking this rate gives you insight into underlying workplace issues.
Formula: Absence Rate = (Total number of days absent ÷ Total number of scheduled workdays) × 100
How to calculate it, step-by-step:
- Multiply number of employees by scheduled workdays. That’s your total potential days.
- Add up total absences across your team.
- Use the formula to find your absence rate.
Example:
- 10 employees × 240 days = 2,400 scheduled workdays
- 60 total absences
- Absence rate: (60 ÷ 2,400) × 100 = 2.5%
Why this matters: A rising absence rate can signal mental health issues, disengagement, or even toxic management. Catching this early helps you take preventive action.
How to Implement a Retention KPI Tracking System
Tracking retention KPIs helps you pinpoint what’s working, what’s not, and where you need to act. When done right, this system gives HR leaders the power to proactively protect top talent, rather than reactively scramble after exit interviews.
Let’s walk through exactly how to implement a retention KPI tracking system that’s simple, strategic, and totally doable — no PhD in data science required.
Step 1: Define the Business Goals for Retention Tracking
Before you set a single metric, make the "why" crystal clear.
Start by clarifying how a retention KPI tracking system aligns with your long-term talent strategy. Are you looking to reduce costs from churn? Improve engagement? Foster long-term growth? Being able to tie retention improvements to larger organizational goals — like productivity or performance — will make the case for investment easier to secure and easier to sustain.
This step is especially important when communicating with the C-suite. According to Wellhub’s Return on Wellbeing 2025 report, 58% of CEOs say employee wellbeing is just as important as salary, and 73% say wellbeing programs improve retention. This is your cue: if you can measure it, you can improve it.
Step 2: Choose the Right Retention KPIs
Now it’s time to get specific — and strategic.
Retention KPIs should go beyond just tracking how many people leave. Your system should include both lagging and leading indicators. Lagging indicators include overall turnover rate, regrettable attrition, and new hire retention at 30, 60, and 90 days. Leading indicators might include engagement survey results, manager effectiveness scores, or internal mobility rates.
Each KPI should be SMART: Specific, Measurable, Achievable, Relevant, and Time-bound. For example: “Reduce first-year turnover by 15% over the next 12 months.” That’s a KPI you can track, benchmark, and act on.
Step 3: Audit Your Existing Data Landscape
You can’t track what you can’t see.
Before building your system, assess the data you already have. What’s being tracked today? What platforms are involved (HRIS, ATS, pulse survey tools)? Who owns the data, and who needs access to it? A good retention tracking system pulls from multiple sources — not just exit surveys.
Be honest about your gaps. If you’re not consistently collecting engagement data, or your turnover numbers aren’t segmented by role or manager, now’s the time to course-correct. This foundational step ensures your system is built on clean, consistent, and comprehensive data.

Step 4: Build Cross-Functional Buy-In
Retention is not HR’s problem alone — it’s everyone’s responsibility.
Loop in stakeholders from finance, operations, IT, and department heads early. They can help refine KPIs, validate data, and shape how insights are shared. This collaborative step builds shared accountability — and helps ensure your system actually gets used.
And here’s a tip: showing department leaders their team-specific attrition metrics often lights a fire. When you give managers the ability to see and act on retention trends, they become partners in improving them.
Step 5: Select and Configure Your Tracking Tools
It’s time to choose your system’s home.
Whether you use your existing HRIS or adopt a specialized dashboard tool, the goal is to centralize your retention metrics in a platform that’s accessible, visual, and updated in real time (or close to it). Prioritize tools that can:
- Integrate with existing systems
- Allow data slicing by team, department, tenure, and more
- Display visual trends over time
- Automate reporting and alerts
Even a basic system built in Excel can work as a starting point — just be sure it’s built to scale.
Step 6: Establish Your Reporting Cadence
If you want your KPIs to matter, you need to keep them front and center.
Create a reporting rhythm that aligns with your business cadence. Monthly or quarterly updates to the leadership team are typical. Dashboards should be refreshed regularly and discussed in HRBP meetings or business reviews.
And don’t forget feedback loops — reporting should spark discussion and decisions. Highlight wins (like a drop in voluntary turnover) and call out risks (such as increasing turnover in a key team). This ensures the system is used as a living tool, not just a dusty spreadsheet.
Step 7: Train Managers on Data Literacy
Turn insights into action by empowering the people closest to the problem.
HR leaders should equip managers with the knowledge to read, understand, and act on retention metrics. Offer training on how to interpret trends, use pulse survey feedback, and link behaviors (like recognition, workload, or flexibility) to turnover patterns.
Managers who understand their team’s retention KPIs are better equipped to prevent regrettable losses. This is where you move from monitoring retention to actively improving it.
Not all turnover is the same. Find out which types matter most—and how to manage them strategically.
Step 8: Use Insights to Shape Strategy
Data is only as powerful as what you do with it.
Once your tracking system is running, begin using the insights to inform programs, benefits, and policy shifts. Are mid-level managers burning out? Consider leadership coaching. Are first-year employees leaving? Invest in onboarding. Did engagement drop after a return-to-office mandate? That’s your sign to reevaluate flexibility policies.
Retention tracking isn’t about punishment — it’s a guide to what your people need most. Use the data to invest in the experiences that help them stay and thrive.
Step 9: Review and Refine Regularly
You’re not done — and that’s a good thing.
A tracking system isn’t “set it and forget it.” You’ll need to reassess your KPIs, update your tools, and adjust your strategy at least annually. Business goals shift. Labor markets change. What works today may not work tomorrow.
Set a yearly KPI audit to evaluate whether your metrics still align with organizational priorities. And always keep an eye out for new signals — like internal mobility rates or manager tenure — that could add predictive power to your system.
Step 10: Celebrate Progress and Share Results
End with action and affirmation.
When retention improves — even incrementally — share it! Highlight wins in all-hands meetings, executive dashboards, and HR newsletters. Recognize departments that made real strides. This creates visibility, builds momentum, and reinforces that the system works.
And remember: this is about more than numbers. It’s about building a workplace people want to stay in. A strong retention tracking system is one of the most powerful tools to help you do just that.
Boost Retention by Investing in Employee Wellbeing
Tracking retention metrics helps spot issues early, but it doesn’t fix what’s driving employees out the door. Burnout, disengagement, and weak onboarding often sit at the core of rising turnover.
A strong employee wellbeing program addresses these issues head-on. It helps employees feel valued, supported, and energized — which directly improves retention. In fact, 73% of CEOs say wellbeing programs improve employee retention, according to Wellhub’s report Return on Wellbeing 2025: The CEO Edition. Better retention means lower turnover costs, stronger teams, and a healthier culture.
Speak with a Wellhub Wellbeing Specialist to turn your retention insights into real results.

Company healthcare costs drop by up to 35% with Wellhub*
See how we can help you reduce your healthcare spending.
[*] Based on proprietary research comparing healthcare costs of active Wellhub users to non-users.
Category
Share

The Wellhub Editorial Team empowers HR leaders to support worker wellbeing. Our original research, trend analyses, and helpful how-tos provide the tools they need to improve workforce wellness in today's fast-shifting professional landscape.
Subscribe
Our weekly newsletter is your source of education and inspiration to help you create a corporate wellness program that actually matters.
Subscribe
Our weekly newsletter is your source of education and inspiration to help you create a corporate wellness program that actually matters.
You May Also Like

Talent Management: Definition, Benefits, and Strategies | Wellhub
Discover talent management best practices to attract, retain, and develop top talent. Leverage these benefits and strategie to align with your business goals.

Employment At Will: What It Means for Employers | Wellhub
At-will employment offers termination flexibility for employers and employees. Explore strategies to mitigate risks and ensure fair practices in the workplace.

6 Essential Team Lead Responsibilities | Wellhub
Team leads take on many responsibilities to help their team be successful. Discover which responsibilities are the most critical for success.